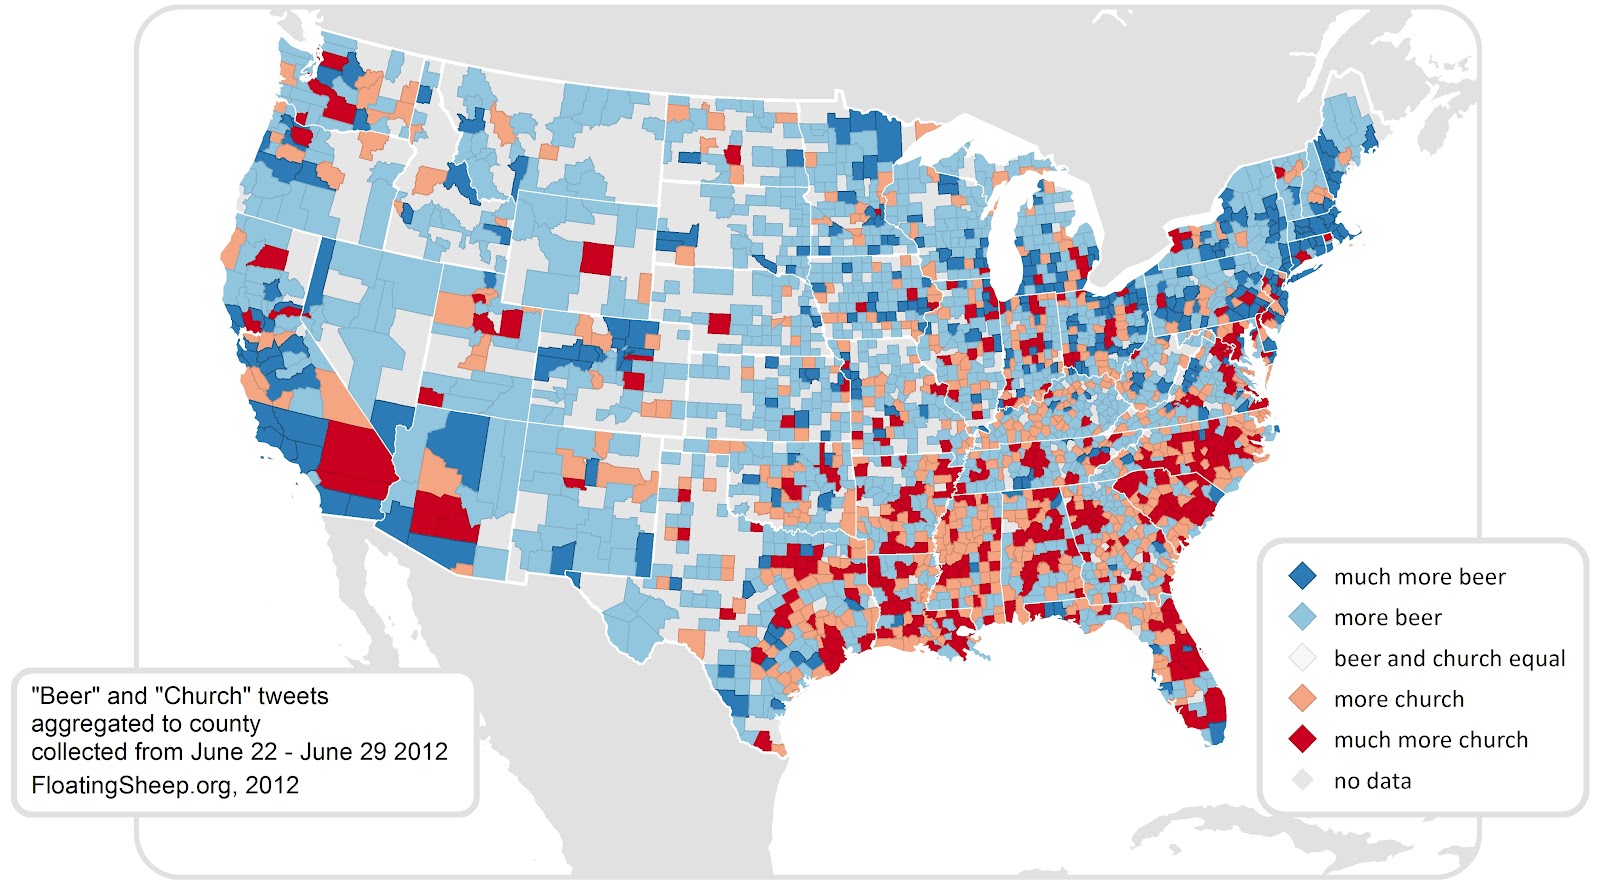
The folks over at www.floatingsheep.org put together a nice little Infographic on the difference between tweeting about beer or tweeting about church. The sample data set was from June 22, 2012 through June 29, 2012 and looked for either the word “Beer” or “Church” in a tweet. They found a total of 17,686 tweet mentioning “church” (half of which were sent on a Sunday) and 14,405 tweets mentioning “beer”.
The data was reviewed further to break down the numbers by state. Below is the breakdown on a per county basis of the tweets.
They also created another graphic that clearly shows a north South divide in the country between these two keywords.
Given the cultural content of the “church” tweets, the clustering of relatively more “church” than “beer” content in the southeast relative to the north-east suggests that this could be a good way to identify the contours of regional difference. In order to quantify these splits, we ran a Moran’s I test for spatial auto-correlation which proved to be highly significant as well. Without going into too much detail, this test shows which counties with high numbers of church tweets are surrounded by counties with similar patterns (marked in red) and which counties with many beer tweets are surrounded by like-tweeting counties (marked in blue). Intriguingly there is a clear regional (largely north-south split) in tweeting topics which highlights the enduring nature of local cultural practices even when using the latest technologies for communication.
I’m not sure what this means, but in Maryland, we seem to be right in the middle, and that’s fine with me.
Source: http://www.floatingsheep.org/


Follow Us!